Are Americans getting richer?
A nickel ain’t worth a dime anymore...or is it?
Ah, the good old days. I don’t think I was alive for them but I get nostalgic anyway. Back when you could pay rent with the loose change in your pocket. When Coca-Cola was still made with real cocaine. When accusing someone of being communist still meant something. It was a simpler time. But were people better off financially back then? To answer, let’s do an analysis where we compare 1973 to 2019. 2019 represents the present. We can’t use more recent data because, well, COVID. 1973 represents the good old days. Was 1973 technically the good old days? Unclear. It may have been 1993, or 1943, or 1783. I guess all days are the good old days if you wait long enough. But it’s the earliest comparable data point I could find so it will have to do.
Do we make more money now or in 1973?
Yes. But of course, there is a caveat. Income growth is not equally distributed, as this chart from Advisor Perspectives shows:
Whether you, as an individual, are richer is dependent on where in the income distribution you are. It’s like asking if you would be better off financially today vs. in Ancient Greece. If you were the firstborn son of an Athenian senator, then you can make the case. If you are anyone else, probably not. If you are one of those babies they tossed in a volcano to appease the gods, then definitely not.
Now that we have caveated appropriately: adjusted for inflation the median household makes 26% more than they did in 1973, which means income increased about 0.5% per year. So yes, we make more money today than in the good old days.
Ok, we have higher incomes. Are we richer?
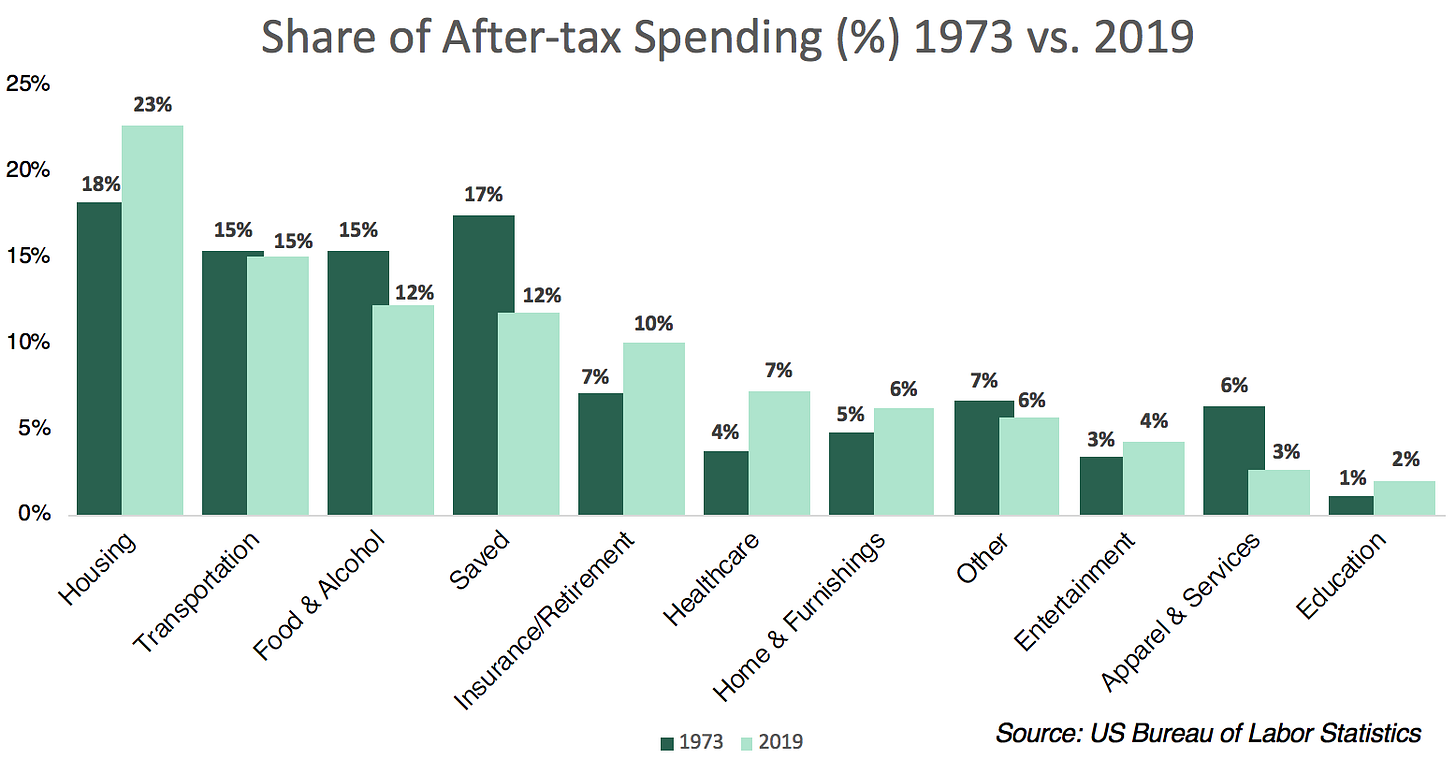
To answer this question we have to balance the income growth of 26% with the cost of living increase. The average (inflation-adjusted) amount spent on housing has increased 45% since 1973. The cost of education and healthcare have increased 106% and 116%, respectively. On the other hand, cost of food has decreased 12% and spending on apparel is down 54%. An easier way to look at this is how spending has changed as a percentage of after-tax earnings.
This chart shows that a greater proportion of our budget is going toward necessities like housing and healthcare. However, while we are spending more, we are also getting more in many cases. The nominal cost of monthly electricity spending is more or less unchanged since 1971, but you actually get 2x the light per penny [1]. And sure, healthcare and rent are up, but people are living longer [2] and average home sizes have almost doubled [3]. In 1973 a basic calculator cost $863 in today’s dollars [4]. Today you can buy a TI-83 calculator for less than that, although why anyone would buy one of those is beyond me [update - I wrote a post on the TI-83]. With $863 you can buy a laptop, download a graphing calculator for free, and still have enough left over to buy a few hundred social security numbers on the dark web.
The bottom line
The reality is that the data supports both sides of the argument. We can sit here and pluck petals (the data love me, the data love me not) but it’s hard to argue that people are unequivocally better or worse off financially. That, though, is an insight in itself. Inflation-adjusted GDP has more than tripled since 1973. GDP is gross domestic product - it measures how much stuff is produced in the US. We have three times as much stuff as we used to have! In GDP terms, the year 2019 could buy the year 1973 and still have enough leftover to botch a dozen Iraq invasions. Yet still, so many people romanticize about the good old days, when life was more affordable: rent was cheaper, tuition reasonable, healthcare rational, and lava lamps were a thing, which is pretty cool. When you poll Americans today and ask if they are financially better off than their parents, only 50% answer yes. We have three times the wealth, but half the population doesn’t feel any wealthier.
Additional Reading
Bureau of Labor Statistics: really detailed data on behavior and spending of US households.
Mary Meeker's Internet Trends Report: Mary Meeker is a Venture Capitalist who does some really great research on a variety of topics. I’m linking to a 2017 report she did that includes work on US household spending over time.
A Review of 100 Years of US Consumer Spending: A longer view on US household spending.
Sources
[1] William Nordhaus Paper on the Light Efficiency


Graphing calculators were a much more expensive GameBoy for high school students